Technical analysis of production data
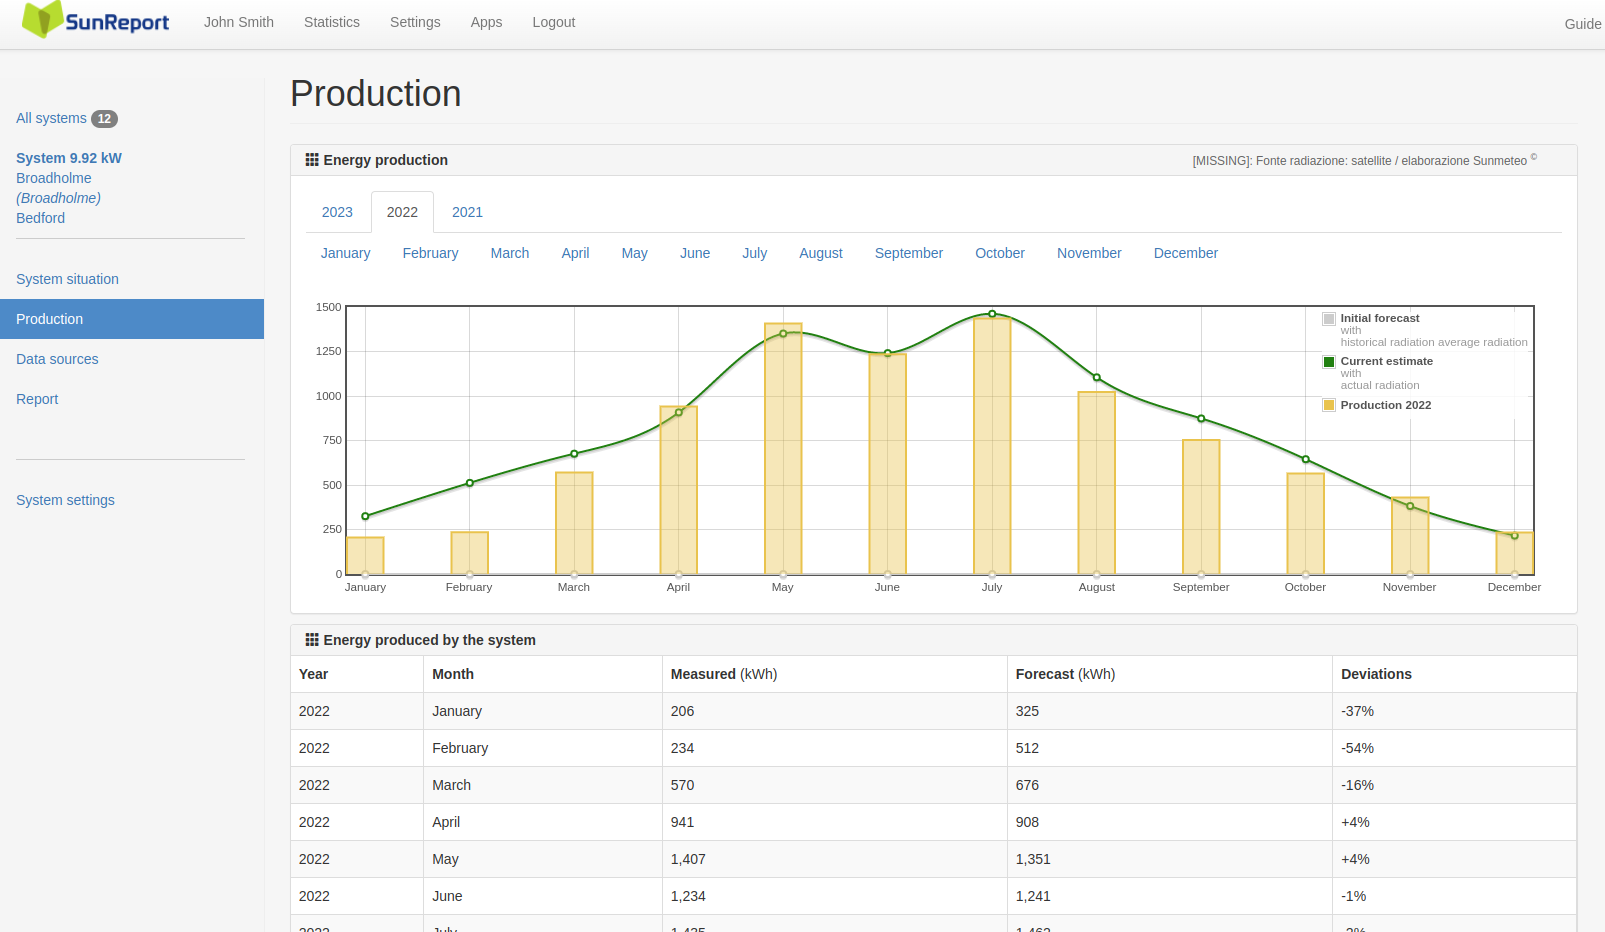
Having all the historical production data of the photovoltaic system, in the production section it is possible to check and analyze the performance trend of the system over the past years up to the last available month. Below the graph is a table that indicates the monthly deviation of the expected energy from the measured energy and the annual total as a percentage.
The screen represents the production of your photovoltaic system during the year compared with two different curves. The gray curve reproduces the production of your photovoltaic system taking into account the historical weather data (for statistical purposes only). The green curve is the most significant as it takes into account the actual weather data obtained from the satellite.